Practical tools for exploratory visualization
Carson Sievert
May 2nd, 2017
Slides: https://bit.ly/plotcon17-talk
Twitter: @cpsievert
GitHub: @cpsievert
Email: cpsievert1@gmail.com
Web: http://cpsievert.github.io/
Data Science Workflow
I love this diagram from the R for Data Science book.
Concisely captures the main components.
Expository vis
plotly.js is awesome for expository/scientific vis!
The web has become the preferred medium for communicating results.
Once you know what you want to show, plotly.js is a great choice!!
Exploratory vis
- Data scientists have to juggle many technolgies (R, Python, JavaScript)
JavaScript lacks tools for iteration (necessary for exploration/discovery!)
It is all too easy for statistical thinking to be swamped by programming tasks.

Quote from Brian D. Ripley
So, this is me, in my 2nd year of grad school, deciding to learn D3 & JavaScript.
It took me 6+ months to implement a single interactive visualization.
And let me tell you, you guys, no joke, believe me, I arose from the swamp, and decide I alone will...
☝ 🍊

My mission
A single (R) interface that:
- Doesn't require knowledge of web technologies.
- Works seamlessly with other "tidy" tools in R.
- Easy1 to declare interactive techniques that support common data analysis tasks2.
[1]: 80% should be easy (i.e., don't require extra knowledge), but the remaining 20% should be possible.
[2]: Analysts usually have different needs from the terminal audience.
Interactivity augments data exploration!
- Identify structure that otherwise goes missing (Tukey 1972).
- Interactive techniques foster data analysis tasks (Cook et al 1996).
- Finding Gestalt, posing queries, and making comparisons.
- Better understand/diagnose models (Wickham, Cook, & Hofmann 2015).
- Let's not forget -- statisticians have been thinking about the problem for 50 years!
- Easy to get lost in a sea of techniques -- easier if you motivate via data analysis tasks.
- Not everyone has a need to diagnose models, but everyone has a need to get stuff done
Interactivity augments data exploration!
- Identify structure that otherwise goes missing (Tukey 1972).
- Interactive techniques foster data analysis tasks (Cook et al 1996).
- Finding Gestalt, posing queries, and making comparisons.
- Better understand/diagnose models (Wickham, Cook, & Hofmann 2015).
- Generate insights faster (Hofmann & Unwin 1999).

This is especially true as data becomes more accessible...less formal mathematical models testing exact questions, more flexible tools for posing graphical queries about data
No matter how complex and polished the individual operations are, it is often
the quality of the glue that most directly determines the power of the system.
Quote from Hal Abelson -- part of the tidyverse manifesto
Generating faster insights requires good glue. This comes in two parts:
- Works seamlessly with other programming interfaces (iteration time!)
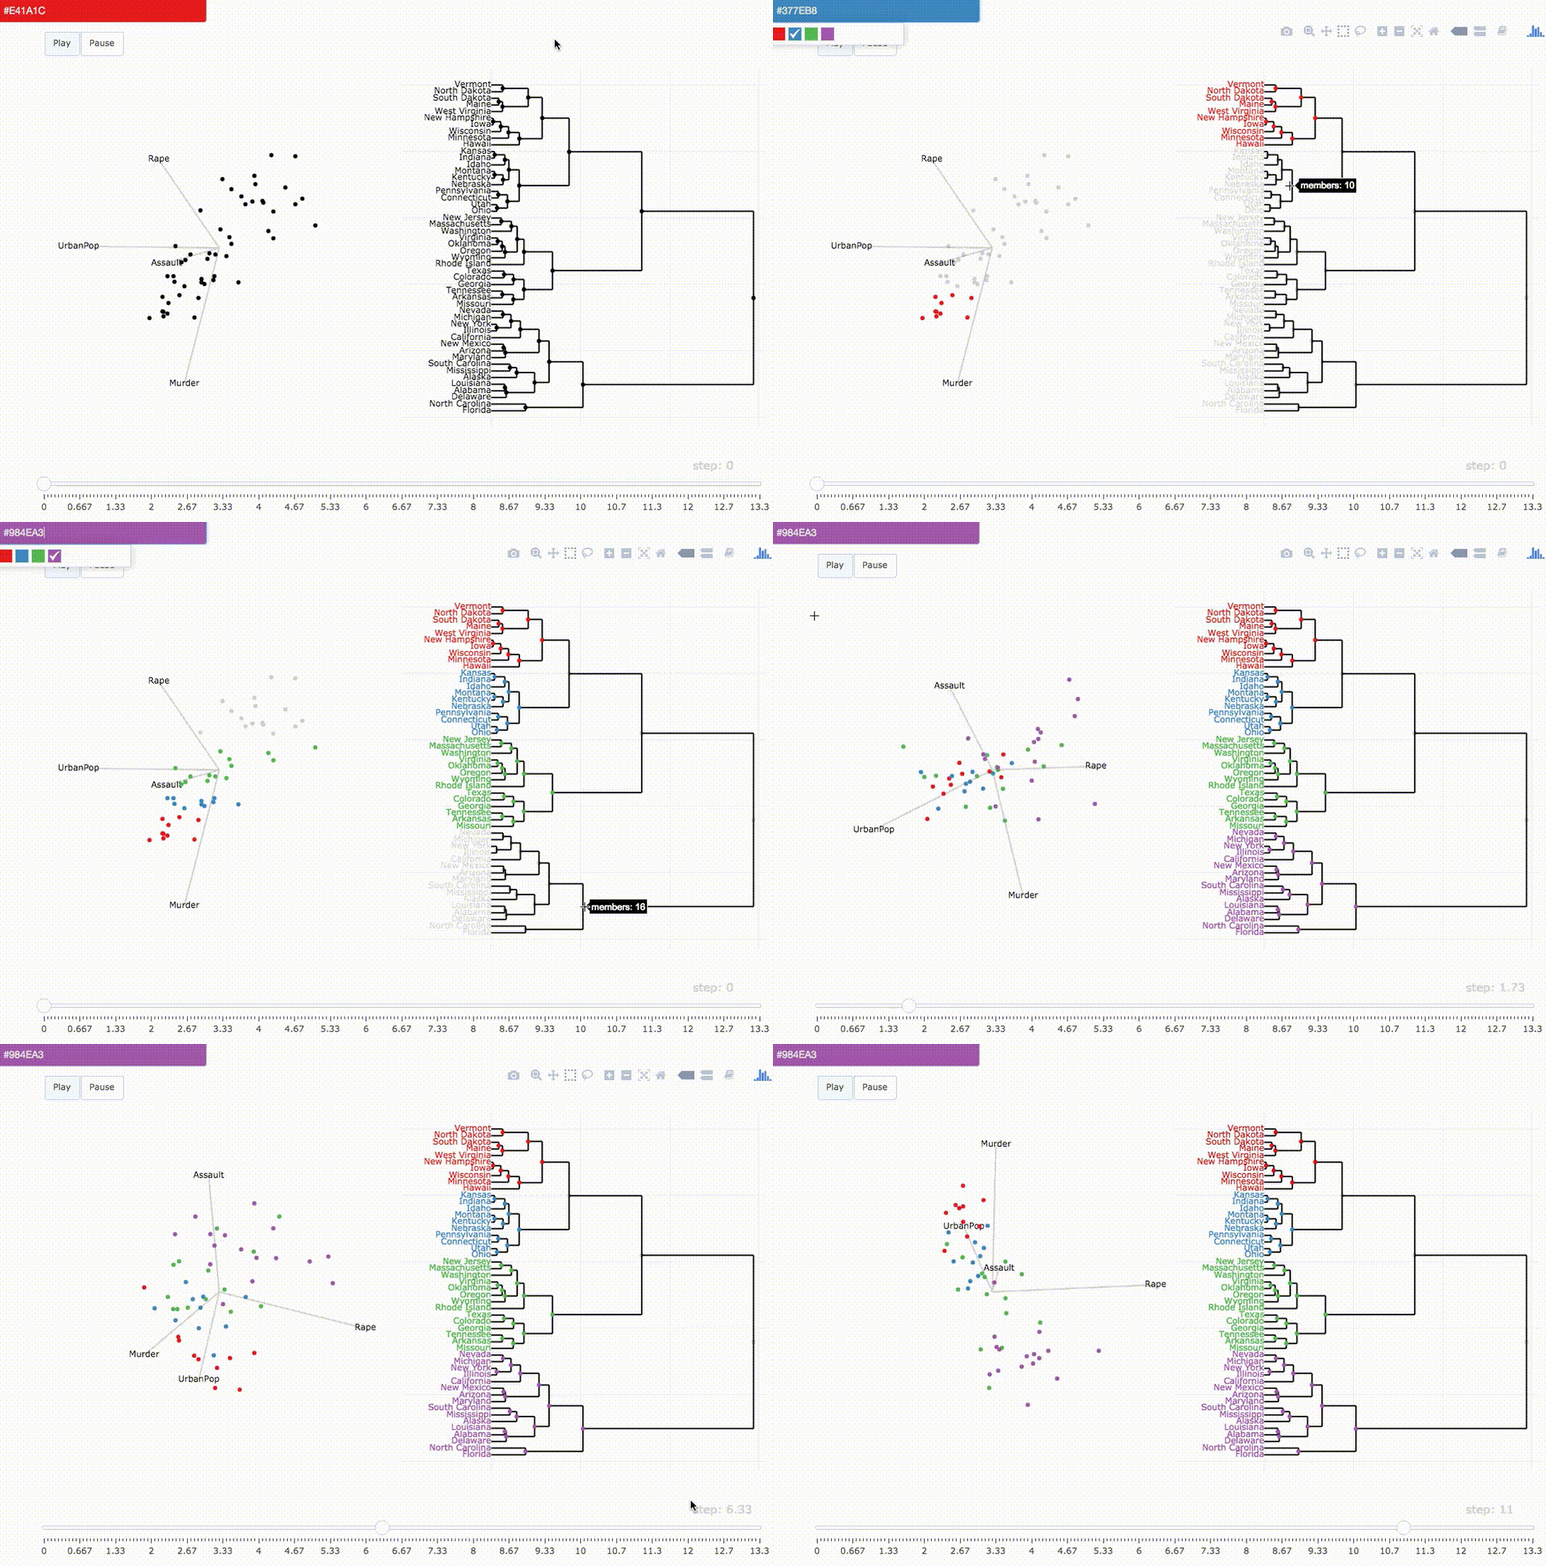
- Works seamlessly with other graphical interfaces (i.e., can link components from independent systems).
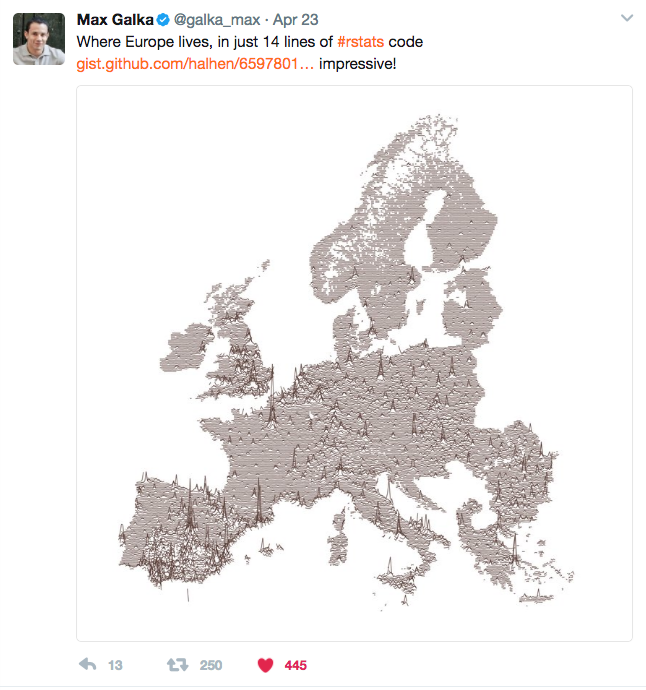
library(tidyverse)library(plotly)d <- read_csv('GEOSTAT_grid_POP_1K_2011_V2_0_1.csv') %>% rbind(read_csv('JRC-GHSL_AIT-grid-POP_1K_2011.csv') %>% mutate(TOT_P_CON_DT = '')) %>% mutate( lat = as.numeric(gsub('.*N([0-9]+)[EW].*', '\\1', GRD_ID))/100, lng = as.numeric(gsub('.*[EW]([0-9]+)', '\\1', GRD_ID)) * ifelse(gsub('.*([EW]).*', '\\1', GRD_ID) == 'W', -1, 1) / 100 ) %>% filter(lng > 25, lng < 60) %>% group_by(lat = round(lat, 1), lng = round(lng, 1)) %>% summarize(value = sum(TOT_P, na.rm = T)) %>% ungroup() %>% tidyr::complete(lat, lng)# make each latitude "highlight-able"sd <- crosstalk::SharedData$new(d, ~lat)p <- ggplot(sd, aes(lng, lat + 5*(value / max(value, na.rm = T)))) + geom_line( aes(group = lat, text = paste("Population:", value)), size = 0.4, alpha = 0.8, color = '#5A3E37', na.rm = T ) + coord_equal(0.9) + ggthemes::theme_map()ggplotly(p) %>% highlight(persistent = TRUE)Customize/transform the selection
highlight( gg, persistent = TRUE, dynamic = TRUE, selectize = TRUE, selected = attrs_selected(mode = "markers+lines", marker = list(symbol="x")))Link with other widgets
library(leaflet)library(crosstalk)library(plotly)sd <- SharedData$new(quakes)stations <- filter_slider("station", "Number of Stations", sd, ~stations)p <- plot_ly(sd, x = ~depth, y = ~mag) %>% add_markers(alpha = 0.5) %>% highlight("plotly_selected", dynamic = TRUE)map <- leaflet(sd) %>% addTiles() %>% addCircles()bscols(p, map, stations)library(leaflet)library(crosstalk)library(plotly)# Input data for every view!sd <- SharedData$new(quakes)stations <- filter_slider("station", "Number of Stations", sd, ~stations)p <- plot_ly(sd, x = ~depth, y = ~mag) %>% add_markers(alpha = 0.5) %>% highlight("plotly_selected", dynamic = TRUE)map <- leaflet(sd) %>% addTiles() %>% addCircles()bscols(p, map, stations)TAKE HOME MESSAGE: Build upon uniform data structures!
Standing on the shoulders of giants
Thank you! Questions?
Slides released under Creative Commons


